
A large set of from the AR5 IPCC zero order draft files was released at the Galloping Camel site. These represent working group II Impacts, Adaptation and Vulnerability chapters aka – disaster files. This section of the IPCC contains some of the most uncertain “work”, which for the survival of their unstated cause, absolutely must be overstated. These drafts typically get toned down, but not eliminated, through the reviews as reasonable heads make comments. Therefore the expected pattern is first those in charge say what they really think, then it gets chopped down over time, a little closer to what could be weakly defensible in a government court. Often in the past, obvious facts have been ignored. Correspondingly and unsurprisingly, this chapter is filled with some of the most extreme global warming conclusions possible in the eyes of a governmental organization operating in the wildly profitable industry of climate science™ alarmism. If you enjoy political propaganda, with a wealth redistribution twist, wrapped in a package only loosely disguised as science, then these are the files for you.
For example the executive summary of Chapter 5 discusses sea level rise:
Sea-level rise of more than one metre by the end of this century poses the single major threat to the coastal areas. More than 200 million people are already vulnerable to flooding by extreme sea levels worldwide and this population could be increased by a factor of 4 due to rising population and coastward migration, especially in Asia. New information is available on the likelihood of increased rates of ocean acidification. Although acidification is being addressed through international mitigation efforts, coastal policies need to address ocean acidification at the local and regional levels. More detailed and useful information would be required for the implementation of such policies.
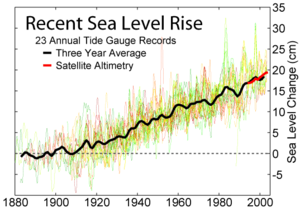
Here is a plot of sea level not rising at 1m/century.
Perhaps Wikipedia’s conservative bias is preventing the proper sea level graphs from being posted.

Because as we all know, linear extrapolation solves everything!
More seriously, AR4 WGI projected a sea level rise of .3m by 2099 (A1B scenario). However, this only covers thermal expansion. Potential contributions from melting ice caps were simply not included, apparently due to lack of data/studies.
Since then, several studies have attempted to model the contribution of melting ice to sea level rise projections. Both the uncertainty and the range of projections go up (duh!). 1m is well within the range of the studies cited by the pdf you link. I don’t know if these are representative of all studies published since AR4.
Then again, this is a ZOD. Evaluating the literature on physical projections is a WGI job. The WGI guys will do their work, and the WGII guys will refine their own report based on the WGI output. Let’s see how that turns out.
> “The WGI guys will do their work, and the WGII guys will refine their own report based on the WGI output.”
If that is the process, why is the zero order draft of WGII being doing in parallel with that of WGI??
“Zeroth order”. It’s an iterative process.
In a cooling globe, fears of a warming one are anachronistic.
==============
I worry that sea level has almost stopped rising. That implies the end of the LIA recovery. Which implies DOOM.
Envisat – .0063m in 7 years = .9mm a year = 90mm in 100 years. 910mm short of the predicted 1m.
2004.789602 4.804213e-01
2011.791182 4.867262e-01
ftp://ftp.aviso.oceanobs.com/pub/oceano/AVISO/indicators/msl/MSL_Serie_EN_Global_NoIB_RWT_GIA_NoAdjust.txt
Re: Bruce (Jan 2 14:54),
Damn straight. Every trend the warmistas deplore is actually positive, starting with more CO2, to more warmth, to melting ice. It’s all good!
Love the little “trademark” – “TM” symbol that you put after the term “climate science.” Very appropriate!!!!!!!!
Toto,
“Because as we all know, linear extrapolation solves everything!”
So you prefer a multivariate high order extrapolation based on only a couple of tuned weight parameters under the bulk title – ‘sea level models’ for your projections! Good stuff.
Fortunately, Bruce, we can keep everyone’s hopes up by burning more and more fossil fuel. Full steam ahead. Women and children to the lifeboats, first.
==============
Toto,
It is reasonable to look at the tone, omissions and admissions of the zod in determining the intent of the message at this point. It isn’t like the zod is a stand-alone document. Most here have read a lot of papers, many have looked at a lot of data, some are on the same political side. The reality is that the progression of the drafts is yet another positive indicator of the political bias of the people involved. Whether you have crossed the threshold of reasonable doubt is your own choice but I have absolutely crossed mine.
It is reasonable to look at the tone, omissions and admissions of the zod in determining the intent of the message at this point.
Sure, but that’s not what I read there. You’re cutting out one sentence from the ZOD, removing all the justifications and citations given for this sentence, and then “disprove” it with a linear extrapolation of whole-20th century rise. Even for the supposedly “wooly” WGII, that won’t do.
the progression of the drafts is yet another positive indicator of the political bias of the people involved.
I think you need to include more parameters in your model :). A more precise description of the reality is that your reaction to the progression of the drafts is an indicator of the difference between the political bias of the authors and yours. As it should be.
Toto,
First, I didn’t extrapolate any linear trend. It can be decidedly non-linear and fall way short of these numbers. You have chosen your own straw man. Again, since you don’t like lines, do you prefer to extrapolate non-linear multivariate curves?
It is important to note that we have experienced sea level rise since well before AGW .2m/century and they have gone completely unnoticed by shore dwelling people. The conclusions of doom from the unrealistic 1m/century are as stupid as the prediction.
As others have pointed out, the increase this century is likely to be nowhere near 1M. That said, even if we assume it is 1M, why anyone would get exercised about a slow rise of 1M over a century is beyond me.
I live only several meters above sea level and I have a hard time seeing why an increase of one meter would have any meaningful impact. First, there are very few structures that are built less than a couple of meters above sea level; indeed most waterfront properties have some setback and at least a fair margin of error of rise from the sea. Second, even those structures that are close to the sea are unlikely to still be here by the end of the century anyway. Sure, there is the occasional church or historical site, but most modern structures don’t stay that long — they succumb to earthquakes, fires, fall into disrepair due to vacancy, get gutted and remodeled, get demolished for some newer construction project and the like long before they reach the century mark. In all those cases, the new construction can simply be built back a bit from the water (and thus a meter higher) without a lot of hassle (or if it can’t be built back can include a retaining area, earth mounds, mitigating vegetation, etc.). Mitigation is clearly a cheaper and more effective strategy for essentially all properties than trying to prevent a sea level rise. But the further point is that, for many properties, mitigation won’t even cost anything; it will be entirely, or nearly, free. That is because over the timeframe we are talking about for meaningful sea level rise (century plus) other factors are far more significant in determining the state of the structures on the property.
Yes, a few beachfront property owners will lose several feet of beachfront, but, hey, anyone living on the water realizes they always face that risk from changing shoreline and erosion generally.
Eric;
Watch your language! “Mitigation” in this debate is reserved for “fixing the forcing” (i.e., CO2 reduction). “Adaptation” to whatever comes (warm/cool, high-dry/low-wet, etc.) is the alternative. The former costs 100X more and achieves 1000X less.
Toto,
Your assertion in the first comment that the AR4 projections for sea level rise are due only to thermal expansion is absolutely incorrect. You cite the chapter that covers only thermal expansion, but if you could be bothered to read the full section on sea level rise (e.g. 10.6.5), you would see that a substantial fraction of the projected expansion is due to Antarctic and Greenland glacier melt. And they project that recent reported increases in the melt will continue.
I have seen this claim made so many times in articles, blogs, and comments when a simple check of the report would disprove it. I wonder what it will take to kill this meme once and for all.