
The “Union of Concerned Scientists” posts this message on its front page…….
Global warming is already having significant and harmful effects on our communities, our health, and our climate. Sea level rise is accelerating. The number of large wildfires is growing. Dangerous heat waves are becoming more common. Extreme storm events are increasing in many areas. More severe droughts are occurring in others.
We must take immediate action to address global warming or these consequences will continue to intensify, grow ever more costly, and increasingly affect the entire planet—including you, your community, and your family.
The good news is that we have the practical solutions at hand to dramatically reduce our carbon emissions, slow the pace of global warming, and pass on a healthier, safer world to future generations.
With your help, we can accomplish it.
Together, we can tackle global warming.
Now I am getting old… well is 45 old yet? …. maybe not but anyway it is older than I was yesterday and I can recall a time when I really believed that nobody and by ‘nobody’ I mean nobody in their right mind, would fall for the insane claims made by global warming “science”. They are really extreme claims. Well the were extreme claims until we had our heads saturated with propaganda from a 100 billion dollar industry. Now they are commonplace. Seriously folks, space science is expensive. Nasa is huge still, the US air force space program is huge, but we spend multiples of that space funding on global warming….. The money is hidden in so many corners that every time I’ve gotten started evaluating funding, I cannot begin to track it. The money supporting global warming alarmism is so massive, and so prevalent, that it would take millions of dollars simply to document it.
And every single penny is being spent for left-wing political causes.
You can’t count it. It is too big. You can’t even imagine all of it, because it doesn’t stop.
It is spent in droves on fake and fraudulent scientific study. It is spent on activism, meetings, travel, hotels, fake energy generation, advertising, vehicles, scientific conferences, equipment, computer centers, political campaigns and every conceivable method of self promotion imagined by anyone who ever considered the subject. The money is endless, as it is government money.
So then we have a group of alleged scientists. A union say, of concerned ones, who believe in an enlightened future for humanity. A future with no CO2 emission, a high fruit and vegetable diet, limited or no nuclear power generation, and fake energy solutions such as biofuel and wind for our future power needs. All based on unscientific reactionism and good feelings. Science does not support much of their conclusion, yet they are a union of concerned scientists and they are happy to conclude for us BUT the conclusions don’t match observation……..
That leaves me concerned.
How is it that so many scientists can gather together and sign their names to unscientific beliefs. The problem is so bad that you can find more scientific fact in a Mosque than you can in the opening quote above.
In fact, this world is so perverted that the Catholic religion is more grounded in science than the Union of Concerned Scientists……..and the Union of Concerned Scientists has greater faith. Shocking..no? Why can I claim their faith is greater than the Catholic religion? Because unlike religion, their claims are demonstrably false. Not moderately tweaked, or potentially subject to interpretation, demonstrably false!
Talk about an inverted perverted, yes is no, right is wrong world………. yet it is our world. You can dissemble every page of the UCS website and will find little beyond political conclusion, but this is ostensibly a climate blog so let’s just look at the climate change claims on the front page of UCS to examine the claims above.
Global warming is already having significant and harmful effects on our communities, our health, and our climate.
FACT: Main stream science holds that current global warming is minimal and difficult to measure by ground stations or even with modern satellite equipment. No attributable trends of any sort on communities, health, and extreme climate events have been positively attributed to temperature change.
Sea level rise is accelerating.
FACT: Sea level rise has been going on for centuries. It has not measurably accelerated, and increases in sea level may have recently reduced. The rate of change in sea level rise has not been successfully correlated to the very mild warming that thousands of land temperature stations have measured. Don’t believe it, check this wikipedia link.
The number of large wildfires is growing.
Now why this particular bit of nonsense would be attached to “climate change” is beyond reasonable, yet it is the third sentence in a 27 million dollar company’s global warming website. Shouldn’t we consider forest management as a primary driver before 0.8 degrees of warming? Shouldn’t we also consider the increased amount of forest we currently have, the lack of allowing smaller fires to occur, or what about the simple fact that 80 years ago we let forests burn without significant documentation. What does that do to the data. Well….. then there is the data.
A simple study found by a google search: http://www.biologicaldiversity.org/news/press_releases/2013/sierra-forest-fire-severity-10-01-2013.html
It found no trend of increasing fire severity in the Sierra Nevada management region in California over the past three decades. In fact, the study found that between 1984 and 2010, the amount of high-severity fire in the Sierra was lower than its natural level, before modern fire suppression.
An unscientific conclusion from the Union of Concerned Scientists? There are plenty of other papers which support this individual conclusion. We shouldn’t be surprised either as the concept that 0.8C would measurably increase “fires” is ludicrous on the face of it.
Dangerous heat waves are becoming more common.
Now you would think that someone like myself who believes in the warming effect of CO2, that I might be inclined to agree with this one. But heat waves are extreme weather events, not long term offsets from the mean temperature, and this claim is as bogus as the others. From the scientifically outrageous left-wing United States EPA —- heat waves.
Heat waves occurred with high frequency in the 1930s, and these remain the most severe heat waves in the U.S. historical record(see Figure 1). Many years of intense drought (the “Dust Bowl”) contributed to these heat waves by depleting soil moisture and reducing the moderating effects of evaporation.
Extreme storm events are increasing in many areas. More severe droughts are occurring in others.
More realistic calculations, based on the underlying physical principles8 that take into account changes in available energy, humidity and wind speed, suggest that there has been little change in drought over the past 60 years.
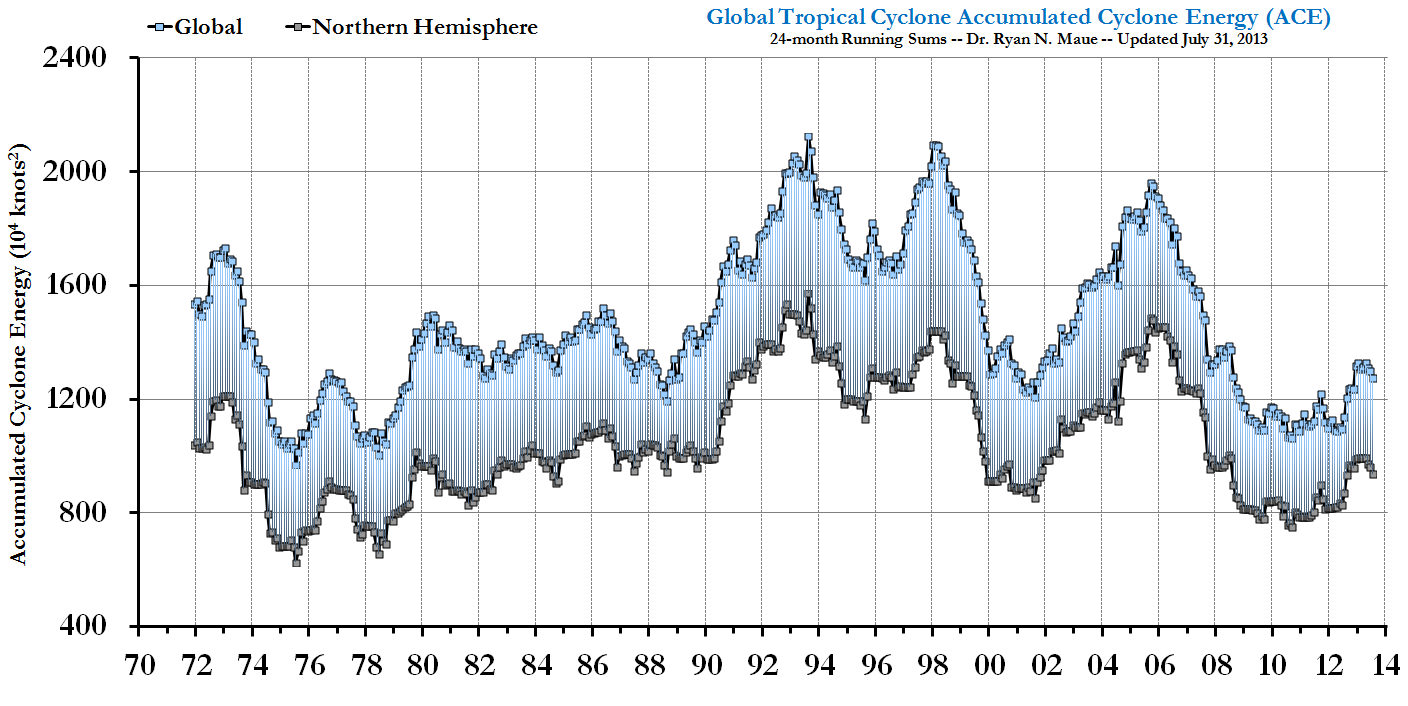
Tropical cyclone accumulated cyclone energy (ACE) has exhibited strikingly large global interannual variability during the past 40‐years. In the pentad since 2006, Northern Hemisphere and global tropical cyclone ACE has decreased dramatically to the lowest levels since the late 1970s. Additionally, the global frequency of tropical cyclones has reached a historical low. Here evidence is presented demonstrating that considerable variability in tropical cyclone ACE is associated with the evolution of the character of observed large‐scale climate mechanisms including the El Niño Southern Oscillation and Pacific Decadal Oscillation. In contrast to record quiet North Pacific tropical cyclone activity in 2010, the North Atlantic basin remained very active by contributing almost one‐third of the overall calendar year global ACE.
So that is just the first paragraph. Not the whole thing but every sentence in the first paragraph on climate change from the union of concerned scientists is false information. My conclusion, and probably yours…… THESE ARE NOT SCIENTISTS.
I can continue with the rest of the next statements, but I don’t have enough time to contradict every paid moron on the planet. These people have a 27 plus million dollar annual budget, and unlike a simple business owner like myself, they have near zero cost for that budget. No real overhead and over 90% profit at zero tax. Their resources are equivalent to a functional and profitable 300 million dollar company (my estimate). Their product is climate alarmism. Yet they claim to be simple scientists who work the table as a side job. Make no mistake by their claims of unbiased scientific understanding, these people are most certainly swayed by the cash.
Now there are still plenty of left-leaning readers still who harbor all kinds of screwed up anti-common sense beliefs about society, taxes and fairness. I ask the following question: If the director of UCS woke up tomorrow and realized, as we all should, that the climate change branch of their organization was bunk, does anyone imagine that she would recommend any change in their public position?
If I woke up tomorrow and observations contradicted my conclusions, I absolutely would change my opinion. Unfortunately, or fortunately for most of us here, our opinions are based on science rather than the money colored faith of the “greens” and our beliefs are influenced by observation. With organizations like this, sweeping things like Climategate under the rug is a priority, sweeping failed climate models under the rug is an emergency.
Watch for it, today climate models are the next climate gate. They have to go as badly as the hockey stick.
The director of the Union for Concerned Scientists is waking up to the exact nightmare scenario that their company cannot absorb… Climate models have failed.
‘Twill be interesting over the next few years to see the response. Don’t get too excited though, killing a company that large isn’t something which can happen overnight and the UCS is a teenie-tiny branch of the whole Medusa. My certainty on this aspect is so great that I don’t believe the global warming industry would be killed by a full-fledged ice age. It would morph, but the seven headed beast would live on.

Modern society is about to witness a re-enactment of the classic battle between good and evil.
[snip — Oliver, please stop posting the neutron stuff. It doesn’t fit with the topic here. Like myself, the readers generally have little background in it so the point is lost on us.
thanks,
Jeff]
I too was a member of the Union of Concerned Scientists for many years, unable to imagine that an alliance of geophysicists emerged from the ruins of WWII to build a “Red Matrix of Deceit” about the energy that destroyed Hiroshima, . . . the energy that creates, destroys and sustains every atom, life and world in the Solar System !
Now I see why post-WWII science became an opponent of spiritual reverence for the Sun.
The Union of Concerned Scientists failed: Thanks to the insight and ability of a few bloggers like you to communicate, “The Great Social Experiment of 1945-2015″ is over.
Click to access Social_Experiment.pdf
Jeff,
On sea level rise, it looks to me from the plot you linked that there is acceleration. And the text that goes with it says so:
“Between 1870 and 2004, global average sea levels rose a total of 195 mm (7.7 in), and 1.46 mm (0.057 in) per year.[5] From 1950 to 2009, measurements show an average annual rise in sea level of 1.7 ± 0.3 mm per year, with satellite data showing a rise of 3.3 ± 0.4 mm per year from 1993 to 2009,[6] The reason for recent increase is unclear, perhaps owing to decadal variation.[7] It is unclear whether the increased rate reflects an increase in the underlying long-term trend.[8]”
3.3 mm/year = 330mm/century = 13 inches a century. Time to start gathering animals and building an Ark?
Happy, New Year, Jeff.
I would be cautious about making any comment on sea-level rise without extensive qualification.
The picture is quite complicated. Jevrejeva 2008 found unequivocal evidence of multidecadal cycles in global MSL, using tide-guage data going back to 1700. This included a supra-dominant quasi-60 year cycle. The analysis was supported subsequently by basin-by-basin analyses (Chambers et al XXXX).) To the extent that one can reliably extract an underlying secular trajectory, the underlying trend seems to show some very mild acceleration – a slight upward curve – but this started some time in the early 18th century. It is hard to believe that it is attributable to CO2 warming, but not difficult to believe that it is associated with warming.
On the other hand if one plots, say, the 10-year OLS derivatives from the modern satellite altimetry data available since 1992, then a clear peak occurs around 2002. In other words it is legitimate to say that sea level rise has been decelerating since 1992, the start of the satellite altimetry data.
A bald statement that “sea level rise is accelerating” or “sea level rise is decelerating” are both equally true or equally misleading.
.
I cannot resist adding that the long-term sea-level data gives rise to a major paradox in climate science, and one which is not just unanswered but largely unrecognised.
We have three possible sources of estimation of net flux imbalance at TOA. (a) Direct satellite measurements of incoming and outgoing radiation (b) Rate of change of ocean heat content from temperature measurements and (c) rate of change of MSL. While none of the three datasets are any good for estimation of absolute values of flux, they are all rather more credible when it comes to estimates of the phasing of changes in flux.
All three modern datasets show a peak in net flux occurring just after the turn of the century. Moreover, detailed breakdown of the MSL data indicates that the peak in the derivative of MSL is due to a peak in rate of heat gain i.e. it is a heat effect rather than a mass change or a tectonic (isostatic rebound) effect.
Why is this a problem for mainstream climate science? Well, climate science says that these oscillatory peaks in temperature which occur every 60 years or so are due to an internal redistribution of heat superposed onto an underlying longer wavelength rising trajectory in temperature. According to foundational theory then, the net downward flux at TOA should therefore show a series of minima corresponding to the times of peak surface temperatures, i.e. when OLR reaches a maximum every 60 years or so. What we actually see instead is the net downward flux hitting a maximum instead of a minimum in the modern datasets.
The long-term MSL data allows us to extend this inference backwards in time. The peaks in net flux derived from the derivative of the MSL data correspond closely to the times of peaks in surface temperature in the 60-year oscillations, going back to around 1700. They are close to pi degrees out of phase with what the theory predicts.
On energetic considerations, the only possible conclusion from these observations is that the 60-year oscillations are forced oscillations. (Yes, the phasing does correspond exactly to what we would expect if these are forced.) I would be interested in any alternative explanations. I spoke to several respected climate scientists about this at a recent RS seminar on feedbacks. No-one could offer any credible challenge to the theory demonstrating the paradox. The common answer in the end was that you cannot trust the data! After hearing this three times I gave up. Meh. The exact same data is good enough to justify Draconian political measures, but not to highlight a self-contradiction?
If these cycles are forced oscillations, the next obvious question is then:- what is the exogenous source of the forcing?
I am less certain about this, but I believe that, given the regularity of the quasi-60 year oscillation going back at least 8000 years (Knudsen et al), the primary source of the external forcing must be orbital, and that the forcing which initiates the cycles is a momentum flux which at present is completely unaccounted for in climate science. As the solid-body Earth undergoes changes in its rotation rate under the normal rules of orbital kinetics, angular momentum is transferred between the solid Earth, the hydrosphere and the atmosphere. The correlation between Atmospheric Angular Momentum and Length-of-Day is well established for the higher frequencies, as is the correlation between AAM and various climate indices. The problem I still have is that the total energy transferred in momentum flux over the 60 year cycle seems to be too small by almost an order of magnitude to fully explain the temperature variation. So, I am still looking for an amplification factor of some sort. Even if I am wrong about the source, however, it does not change the fact that there is a large paradox in climate science theory.
Paul K,
That was one informative, succinct post. Your tone is exactly what we should be getting from all the scientists involved in what ought not to be a struggle for climate truth, but a common cause for it. I’m always tickled when I learn something. I hope Kevin Trenberth reads it. So, thank you. Cheers!
Paul,
I’m not familiar enough with the data but is it possible that the forcing is a function of oceanic mix rates. It seems to me that a hydraulic mixing is something sensitive enough that orbital influences might have a significant effect. Small tweaks in currents could have big effects on temp.
Jeff,
Since I don’t know the “right answer”, I can’t rule out a direct effect on oceanic mixing, but once again, I would note that there is insufficient energy transfer from angular momentum change for this mechanism to explain the full amplitude of temperature variation. My current pet theory is that atmospheric momentum (aka “wind”) is more likely to be the dominant trigger. For example, only a very small change in relative momentum is required to reverse the Tropical Pacific trade winds from their dominant East-to-West track to convert them into westerlies, yet the effect is dramatic. This triggers an El Nino which via teleconnection results in substantial global temperature change. Similarly, the AMOC is generally held to be partly a wind-driven current, and it is the strength of the AMOC which appears to control the phases of the AMO.
There were two papers published in 2013 which I think are highly indicative. One showed that much of the temperature variation from the 1970s to modern-day could be explained in a GCM by prescribing sea-surface temperature in a tiny area of the Tropical Pacific. The second showed that much of the temperature variation could be explained in a GCM by prescribing wind stresses or wind velocities across the tropical Pacific region.
This strongly suggests to me that although the oscillations are orbitally induced, the main energy transfer mechanism is radiative. The change in momentum flux changes the dominant wind pattern – a shift in climate state which then modifies the radiative balance by means of clouds and surface heat redistribution. This would then also explain the substantial SW heating (through reduction of cloud albedo) observed between 1980 and 2000.
I have not found any simple way of testing the theory. Proof of concept requires a GCM, but with NS reframed to preserve momentum – something which GCMs currently do not do – as well as the ability to specify momentum change as an externally imposed boundary condition, a far from tractable problem. At present, I have only a ragbag of suggestive correlations, and can see no way of moving further forwards.
Paul wrote: “There were two papers published in 2013 which I think are highly indicative. One showed that much of the temperature variation from the 1970s to modern-day could be explained in a GCM by prescribing sea-surface temperature in a tiny area of the Tropical Pacific.”
If you look at the last Figure (in the Supplementary Material?) of the first paper, you will see that the prescribed warm Eastern equatorial Pacific SSTs from 1975-1995 enhanced warming by almost as much as the prescribed cool SST’s reduced warming during the hiatus. They didn’t tell us how much heat (global W/m2) they had to add or remove to prescribe the historic SSTs.
Paul_K,
Interesting comments. A couple of observations:
1. A crude look at the slope of the sea level trend (satellite altimetry) shows a statistically significant change in trend near 2004, a couple of years after the start of ‘the pause’, suggesting heat accumulation follows surface temperature, not the other way around.
2. If you account for the short term influence of ENSO on sea level (many have noted the correlation) then this should make the underlying secular trend more clear. I have not found the time to code up this calculation, but it is in principle not difficult to do. (the short term ENSO influence is claimed to be due to rainfall patterns over land, with La Nina increasing the inventory of water on land)
3. Changes in melt rate of land supported ice ought to be contributing to SL change, with higher high latitude temperatures increasing the melt contribution. The melt contribution is independent of TOA imbalance, unlike the steric contribution, which should be proportional to the TOA imbalance.
Anyway, I agree that the rate of sea level rise casts doubt on the simple interpretation offered by climate science.
Somehow my name did not get added to the above comment.
Steve,
Regarding your observations…
1. There are several problems with placing an exact time on peak heat flux from MSL data, the three most obvious being:-
– noisy data, which includes ENSO variation
– the MSL gradient is not just responding to heat flux variation; it is responding to multiple drivers, which importantly includes mass addition which was accelerating over this period according to GRACE
– any oscillatory flux is superimposed onto an apparent overall trend of increasing MSL, which has the effect of time-shifting the zero gradient to a slightly later date.
This said, a moving OLS applied to the raw data suggests a peak occurring around 2001. I would not like to make a call on the relative timing of peak heat flux and peak temperature on the basis of these data alone.
2. I agree that many have noted the correlation between detrended normalized MSL and detrended normalized ENSO indices like MEI with a small lagtime. The two variables also correlate very well with global sst data. However, if you statistically remove the ENSO events, you are not left with a “secular trend”. Rather, you are left with a series of longer wavelength oscillations superposed on a secular trend. Numerous authors have noted that the instrumental period can be subdivided into a series of alternating periods of el nino-dominated temperature rise of about 30 years, followed by la nina-dominated temperature fall of about 30 years. There is a useful discussion here:- http://judithcurry.com/2014/05/07/el-ninos-and-la-ninas-and-global-warming/
My post above really speaks to the question of what causes these periodic shifts in climate state, rather than the particular short-term impact of a single ENSO event.
3. Agreed. But over the modern period the general view is that mass loss was accelerating. It is one of the reasons why we can be fairly certain that the peak in flux was due to thermal effects. Here is an interesting presentation by Nerem – who was trying desperately to understand why MSL wasn’t accelerating as expected! http://conference2011.wcrp-climate.org/orals/B3/Nerem_B3.pdf
I should have chosen my words more carefully; instead of ‘secular’ a better description would be longer term changes, which could of course include oscillatory behavior of longer periods.
Thanks for the link to the Neven presentation. I got a laugh from the ‘satellites may be wrong’ comments, and wonder if he would be asking that question if the measured trend was not decelerating. There is a disturbing consistency in climate science of looking for explanations other than the obvious (the projections are just wrong), whenever the measurements say ‘it’s not as bad as we thought’. It is tiresome and a bit amusing at the same time.
UCS is an old NGO, pushing politics with a political veneer. That they are flat-out deceptive in their sales pitch is not something that bothers them in the least.
Another good one, Jeff. Keep at it.
Tom, am I correct in concluding that your views on CAGW have changed (at least somewhat)?
No, Stan. I have no time for CAGW–I think it’s a political movement, not a scientific position, and the people pushing it are acting thuggishly. On the other hand, I do believe in AGW. I am pleased that so many studies were published last year hinting at the possibility of a very low sensitivity to CO2 concentrations, but I don’t think that gets us out of the woods.
I’ve re-started both of my blogs, and a recent post at 3000 Quads may explain why I’m still concerned. It’s here: http://3000quads.com/2015/01/09/surprising-information-about-co2-concentrations-something-important-here-but-its-halfway-down-the-post/
I write, “I notice that the mean rise in concentrations from 1980 to 1993 has a fairly modest average of 1.45 ppm. However, the average from 1993 to 2013 jumps to 1.96 ppm. Early in the data series, there is only one year over 1.6 ppm increase. In 1994 the increase jumps to 1.75 ppm and from 1994 to 2013 there are only two years with an increase below 1.6 ppm.
Although concentrations have not shown much, if any, effect on surface mean temperatures (the pause is real, after all, even if James Hansen prefers to say temperatures have stalled), the fact that we are emitting very high levels of CO2 is showing up in concentrations.”
Tom,
I’m really starting to believe that the CO2 concentrations aren’t sufficient to offset oceanic influence. Something which is rarely (if ever) discussed on climate blogs is the mix rate of ocean water. Very subtle changes in oceanic mix rate could have a big impact on climate. I don’t have any answers but the fact that CO2 has risen yet temperatures have not followed indicates a substantial moderating effect and the primary and singly most powerful climate variable is the ocean. We don’t discuss the possibility enough and even basic calculations lead to the concept that there is a potential that humans cannot dramatically effect surface temps with CO2. CO2 warming can quite easily overwhelmed by the oceanic heat capacity — for millennia.
The pause doesn’t make sense. It really doesn’t, unless I’m right and oceans are the reason.
I have become quite convinced of this actually. The only avenues to explain the pause that I’m aware of are clouds or ocean mixing and I don’t believe clouds change much over 0.8C of temp rise, so we are left with oceanic mixing. It seems a bit like common sense to me which in my experience generally means that it will turn out right. Maybe I should write an “explain the pause” post such that others can fill in the blanks with a different story.
Hi Jeff,
I look forward to your post on the subject. Some things to think about which need to be explained:-
1) Based on the data we have, poor as it is, the net downward flux and the heat flux into the ocean both seem to peak a little before the occurrences of peak temperatures from the quasi-60 year oscillations. This is compatible with a forced oscillation, but not compatible with a heat redistribution brought about from, say, a simple change in ocean mixing. In the latter case we would expect periods of high temperature (like the 1940’s and the turn of the century) to correspond to oscillatory lows in net downward flux and in ocean heat flux, since OLR should approach highs rather than lows.
2) The main measured change in net flux between 1979 and the late 1990s came from a change in cloud albedo. This translated into an increase in received SW of between 3 and 6 W/m2, depending on sources. Since the turn of the century, cloud albedo has apparently been increasing, with a concomitant reduction in received SW. You commented “I don’t believe that clouds change much over a 0.8C temperature rise”. I suspect that you are thinking of clouds as being solely a temperature-dependent feedback. I think that there is now sufficient observational data for us to know that this is an overly simplistic view. There are specific cloud responses associated with ENSO events, which end up affecting precipitation globally. ( http://www.icess.ucsb.edu/gem/Ropelewski.and.Halpert.1987.patterns.precip.enso.pdf) The cloud characteristics during the El Nino-dominated warm phase of the PDO are different from the La Nina-dominated cold phase. (http://www.scirp.org/journal/PaperInformation.aspx?PaperID=50837#.VL0qvdLF-Sp) This is not a simple temperature dependence – and the resulting net flux change is a function not just of CRE, but also of important changes to the WV field.
3) Given 2) above, I think it is entirely likely that change in cloud cover represents a large part of the unaccounted-for forcing of the 60 year oscillations. And El Nino events can be thought of as a change in ocean mixing – albeit one which is controlled predominantly by atmospheric circulation. This still leaves the question of what is the root cause of these climate shifts every 30 years or so. I think it is forced changes in atmospheric circulation from planetary kinetics, but still cannot provide definitive quantification. It is not the only game in town. However, if you want to proffer ocean mixing as an explanation, I think that you need to suggest what causes the remarkably regular rhythm over the last 8000 years or so (Knudsen et al. 2011). It’s a long time for an unforced oscillation.
Paul,
I have no answers of course, it is hard to get past the huge fluid heat absorber that we live with when considering minor shifts in air temp. The regularity of the ice age oscillations is something I would love an explanation for. As far as general hundred year shifts of a degree or two, I would think that subtle shifts in oceanic currents due to salinity or minor chaotic change in ocean currents would result in some variation. Don’t really know but there is massive available heat capacity at a very cold temperature.
I’m at work now so I can’t read the links – which I do very much appreciate. I will take a shot at them later today.
Now we know what Anthony’s dog has be up to……
soaring wit there? 😉 X1-34
I find a little humor to be “uplifting”…..
1-26E cheers. It’s been 33 years since i last got a lift.
Jeff, the UoCS is a propaganda vehicle. Of course they’re not scientists. Anthony Watts’ dog is a card carrying member, for crying out loud. They give it away in the name — “Union” has been a sure sign of left-wing politics for decades, “Concerned” plays on emotions, not reason; “Scientists” is there just to make it sound authoritative. They get away with it because everybody plays politics; even the professional scientists who have been trained in universities with 95% left-leaning faculties. It can’t help but rub off on the students when they’re so over-exposed to uncritical thought. The biblical admonition to “train up a child in the way he should go and he will not depart from it” is true. That’s why the left dominates the education and media spheres. After that, political herding is easy.
I’d also like to comment on your statement that “Sea level rise has been going on for centuries”. Sea level rise in the 20th century amounted to 7 inches. If this rate of SLR was “normal”, that would amount to 70 inches (1.8 m) over the last millennium and 350 inches (9 m) over the last five millennia. Before the tide gauge record you linked (which began in 1870), we need to rely on the same type of geological records that were used to construct SLR as the last ice age ended. (See linked image.) That data says there is no chance that 7 inch/century of SLR is normal for the past five millennia. About 2 cm/century is a reasonable average for the last 5000 years. Since the SLR from 1870-1950 is clearly abnormal, it is tempting to attribute it to the end of the LIA.
If we look at the record since 1950, SLR has been increasing at about 1 inch/decade. If that rate of increase accelerated at 1 inch/decade/decade for the whole century, the result would be 22 inches of SLR in this century, roughly the IPCC’s central estimate. Right now, there are debates about the statistical significance of the acceleration in SLR, but an acceleration of 1 inch/decade/decade should be easy to detect. We should be able to unambiguously detect the acceleration in the next decade. At the moment, catastrophic SLR (>1 m) is not coming and neither is the IPCC’s central estimate.
Frank,
This comment does not comport with AGW theory. AGW warming only happened in the last 30 years—ish. The sea level rise you claim is unusually high predates modeled CO2 warming.
IMO, the proxy data which creates the curve you show is likely not very good.
Actually, I wrote that too quickly. The proxy data does stink, but it isn’t impossibly bad. The acceleration for the previous century is not related to AGW so we can attribute it to whatever we like as long as it isn’t AGW.
http://www.epa.gov/climatechange/science/indicators/oceans/sea-level.html
There are no human caused changes that a scientist can reasonably claim from that plot. There might be some signal but oceanic increase in depth based on AGW warming just hasn’t happened.
Frank,
There are certainly a few data quality questions with your plot. Local sea-level rise from geological interpretation is influenced by local deposition, local tectonics, regional isostatic rebound, regional ocean floor depression, mass addition, thermal expansion and density change from salinity variation. But let’s assume for the moment that the data are good! They suggest that the overall trend in sea level rise amounts to something less than 0.5mm/year over the last 7000 years – a number that is often cited – but I won’t push back against your estimate of 0.2mm/yr over the last 5000 years. One thing is certain – this overall trend in increasing sea level is NOT caused by coincident temperature change. It is a response to a temperature change which occurred much earlier, after the Younger Dryas, but the temperature trend after Boreal Holocene (last 7000 years) has been downwards. The observed overall rise in sea-level is therefore due largely to mass addition plus post-glacial terrestrial rebound. The overall temperature impact on trend should therefore have been acting as an offset countering these main drivers – at least upto about 1500 bp..
Can we observe any temperature effects at all in the plot? I believe that possibly we can, but firstly it is necessary to mentally eliminate the black line from the plot. This is obtained by setting up tie-points at 1Kyr increments, and then using a least-square error calculation to adjust them, while forcing the later part of the line through a zero value to represent the present day. This is an effective smoothing approach. It cannot capture the variation in the data, and indeed is purposefully designed to eliminate such variation.
Let us just look at the data themselves. I make two assertions – the first is that high-stand data should always be more accurate than low-stand data for the simple reason that the geological record is shorter (or non-existent) and more difficult to interpret for the latter. The second is that interpretation of geological data collected over the last 1000 years is almost completely valueless, because sediments are still being actively worked.
With these caveats in mind, the data show what appear to be a cyclic series of highstand peaks occurring roughly at 4800, 3600, 2500, 1500 and (MUCH more tentatively) at 600 bp(?) These may well be related to flux and temperature cycles, and probably are IMO. But the main point is that the gradients between the lowstand and highstand points reach magnitudes which are far in excess of 0.5mm/yr, and perhaps more comparable with an estimate of 3-4mm/yr. Your modern sample therefore is taken from a time series which has a much longer wavelength cycle than your sample period. Just something for you to consider.
Jeff’s description of the data on this graph from multiple locations is accurate – it sucks. But it is good enough to show that SLR of 7 inches per century isn’t “normal” for the Holocene. (The slope of the slanted line on the right axis is 3.0mm/year = 12 inches/century.) There is plenty of scatter in the data that would allow for atypical centuries where SLR naturally rose at a rate similar the 20th century.
Have either of you heard about Alex Morner’s claims that SLR reported by satellites has been calibrated to match a selected subset of tide gauges. I find the suggestion of cherry-picking by Figure 4 plausible. It is harder to believe that the methodology used to create the satellite record is as non-transparent and flawed as he suggests. http://scienceandpublicpolicy.org/images/stories/papers/reprint/sea_level_not_rising.pdf
Frank,
How do we know what is normal over our timespan. Oceanic rise has been stable much longer than CO2 warming and the proxy data doesn’t have resolution to pick up on century scale variance. If we are to look at the most recent data on the link I provided, the sat curve is pretty flat during some high variance in recent tide guage data. That could not be caused by calibration.
I agree with you though that the concept in your link that sea-level isn’t rising at all, is entirely different from what I am saying, and is implausible in the most generous way it could be said. Sea level is certainly rising, it is also certainly very slow, has inconsequentially minimal impact and to reasonable observation -not accelerating due to AGW.
Frank,
Re Axel Morner’s theory, there is still an outstanding mystery as to why the processed altimetry data changed between 2000 and 2003, but I doubt if the explanation is as sinister as Axel implies. There was a published paper somewhere (Parker ?) which more or less reflected Axel’s views. I’ll see if I can find a reference for it.
On the other hand, here is a paper that takes a credible look at the sources of error in the altimetry data, and which includes high level comparisons with tide-gauge data (Ablain et al): http://www.ocean-sci.net/5/193/2009/os-5-193-2009.pdf
One of Axel’s points which I had missed on first reading was the fact that we should be discriminating between tide-guages in quiescent locations from those in areas of known uplift and subsidence. This makes sense, since they carry quite different error bars. I have no doubt that he would criticise the Ablain et al study on the grounds that the tide-gauge comparison should have been restricted to the subset of tide-guages which were relatively free from problems of vertical land motion. In this he probably does have a good point.
A reference to the Parker paper. Found it in one go!
Click to access prp-2-65-2014.pdf
I thought the prez claimed that his last budget spent a total of 31 billion on global warming. I’ll go see what google turns up.
These guys say 359 billion worldwide. http://heartland.org/policy-documents/global-landscape-climate-finance-2013
That’s only 12 times more than the cost of ending hunger worldwide.
The true costs of the climate obsession are the opportunity and marginal costs: The cleaner coal technologies not developed, the clean drinking water not provided, the hunger not abated, the insurance premiums inflated, the research not funded, all due to obsession over a disaster that is not occurring.
Don’t have anything to add, just wanted to pop in and tell everyone how much I enjoyed this discussion! Happy New Year to all!
Reblogged this on Power To The People and commented:
All Of Green’s DoomsDay Predictions Have Been Proven False By Reality – Denying inexpensive energy in the Third World To Poor People In A Fool’s Quest To Save Earth Is A Form Of Criminally Negligent Homicide
“I don’t believe the global warming industry would be killed by a full-fledged ice age. It would morph, but the seven headed beast would live on.”
You nailed that. I have a rather nasty commenter at my blog who keeps using the word “believe” in relation to AGW theory and I keep coming back with PROVE as the standard.But it doesn’t matter since whatever they believe is what they will continue to repeat and if you dare to disagree it will be like the Catholic Church punishing Galileo for heresy.
The Warmers are the true flat earth believers.
And you’re also correct. There’s very little “green” about this crowd other than the color of their money.
Today we live in a strange world with a battle-line separating:
1. Political powers and consensus ‘scientists’ adjusting experimental data on one side.
2. A benevolent creator and sustainer of every atom, life and world on the other side.
Side 1 directs society to UN’s Agenda 21: http://habitat.igc.org/agenda21/index.htm
Side 2 directs society to a much Higher Power: https://dl.dropboxusercontent.com/u/10640850/Solar_Energy_For_Review.pdf
Omanuel: You’ll be labeled as a flat earther and denier for insisting the the SUN is the source of warming an cooling on earth. Unless of course the lefties find a way to tax the Sun.
The lefties may not realize it, but . . .
the battle ended when the battle lines were correctly identified!
I looked quite hard at the UoCS some years ago and came to the conclusion that that organisation is deeply leftward politically and deeply dishonest. Despite my absolute lack of science qualifications (all my qualifications are in fine Arts and education), I would have been accepted as a full member upon giging them my credit card details. I am also aware that Anthony Watt’s dog became a member, which just about says all that needs be said on the topic.
This is my first visit here and I have found the visit interesting, but feel I don’t have too much to share apart from my suspicion of Socialists, Communists, Environmentalists, Greens and Utopians.