
I get grumpy when people say stuff. Just because you want an election to go your way, doesn’t change facts or statistics.
Oakland county gained 127,000 votes from 2016-2020. During that time period, they only gained 22,000 in population. The new, first time voters in Oakland went 2.5:1 for Biden. Ballot harvesting was completely illegal in Michigan at that time, but we have video of the ballot boxes being stuffed, so we don’t have to worry about harvesting. Nor do we have to worry as to whether shenanigans were being played, because we have video and cell records showing quite clearly that there was a lot of fraud in Michigan.
The only real questions we have are, can we detect the problems statistically, and were they enough to change the election. The other questions about fraud are known facts at this point.
Ohio had a fairly clean vote as shown below. This plot uses a log axis and despite there being numerous cities, lots of downtowns and industry in a state adjacent to and of the same size as Michigan, they have a clean bell curve.

Michigan, on the other hand, suffered unconstitutional changes to the voting methods. They allowed ID free voting for the first time in the state and treated in person voters completely differently from mail-in voters. When combined with voter rolls full of people who have moved and no longer exist, this creates a lot of surplus ballots that can be collected easily and voted without fear of reprisal. This favors high-density population areas and it cannot be countered by the conservatives, no matter what they claim on TV these days. All forms of redress were completely removed from the process and almost no signatures were rejected.
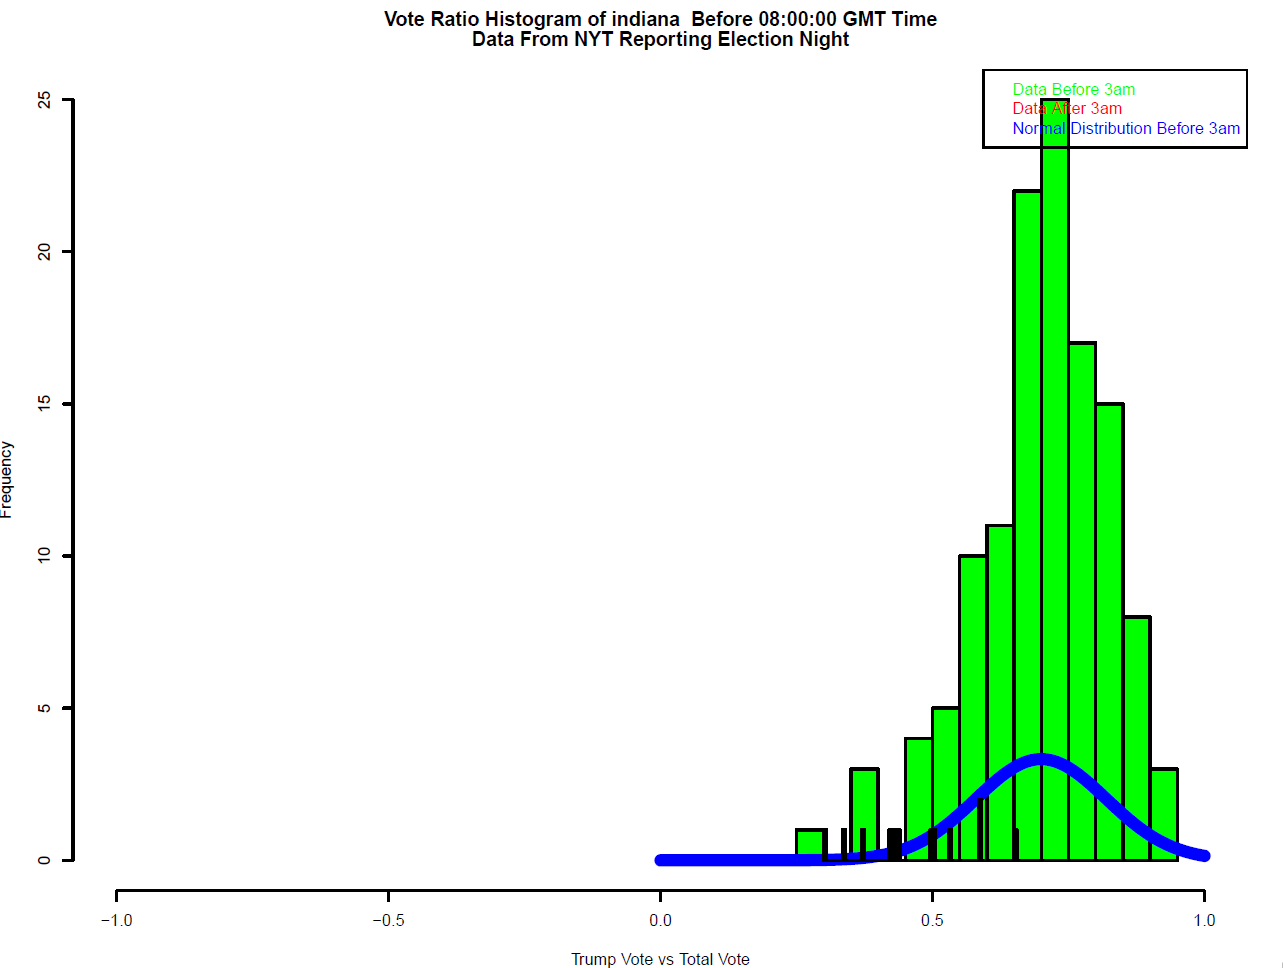
They call the pro-biden points on the right side of this graph below a long-tailed distribution. This is a non-normality that is actually quite severe and should call the voting data into question by itself. When you realize how non-normal it actually is, that is when we go into stupid land.
Below is Biden votes/Trump votes on a log scale.

This next plot is the same data as the Michigan plot in graph 2, showing only the Biden favored vote returns. The difference is that I’ve simplified it so you can see the linear (non-log) ratio’s of Biden/Trump. The farthest right point says that for every Trump voter in this return, there were 23 (see X axis) Biden votes recorded. This single return represents a very heavily pre-sorted block of ballots that is statistically not a subset of the voters in Wayne county. For comparison as a whole, all voters together in Wayne county voted 70 percent Biden which is right in the middle of the bell curve on the far left side of the graph where it belongs.

The Wayne county block of ballots is the single largest return recorded in the state of Michigan. It was also reported at 6:30am on the 4th. This block of voters voted more Democrat than nearly everyone in the entire United States. You thought San Fransisco or Washington DC, were leftists? Nope. Just this group of Detroit folks are. Keep in mind, overall Wayne voted only 70% Biden which is well inside the bell curve on the left. Wayne lost 20,000 in population during that same time period and still managed to add 113,000 new voters that went to Biden at just over 2:1.
The green arrow in the last plot indicates the second largest return in Michigan and it is from Oakland county. In total, Oakland voted 57% democrat which again is fairly normal for Oakland and well inside the bell curve on the far left. What makes Oakland so stupidly out of whack in 2020, is that they added 127,000 new voters while increasing their population only 22,000. Pretty good work for a state without ballot harvesting IMHO. They then reported this single vote return (green arrow in the last plot above) in the 12:1 range for Biden which was waaaay outside of the bell curve and they did it at 4am.
Taken together these ridiculous return ratios flipped the state of Michigan to Biden. They are not the whole of the problem either. In graph two, you can see a non-normal distribution representing two bell curves overlaid in the plot. A bimodal disrtibution. This second hump indicates an entirely different subset of vote returns than the main group. This bimodal pattern is what you would expect to see if ballots were injected into the election.
If these voting patterns are normal, why doesn’t it happen in these states?
Ohio above.
It’s easy to answer actually, states already voting left didn’t have Zuckerbucks used to buy votes. Battleground states needed the fraud to flip them. Ohio required ID.
Arguments that don’t make mathematical sense.
- People don’t like Trump
- Some don’t some do, this argument is one of magnitudes and statistical impossibilities.
- They voted that hard left before
- In some cases this may be true, however the fact that statistically demonstrable fraud has happened before doesn’t mean that it didn’t happen again.
- You assume all voters are the same
- Not true. The bell curve represents the full distribution of the voters. This argument could not be made without taking the distribution of voters into account.
No matter what you want to believe, we still have the ballot stuffing tracked by cell phone, on video and in confessions. These statistics prove that it was sufficient to flip the election in Michigan.
Below are images of mules putting multiple ballots into drop boxes in Detroit Michigan. Every one of them is taking pictures of the ballots as they are placed. These pictures were used to collect payment.


Thanks Jeff,
I hope Richard (The Cliff……) comments and shows what is wrong with your maths and vote numbers.
This stuff was meant to be debated in Congress on January 6 th. Hundreds and thousands of votes at 6 am the next day!!!!
Ray
Very off topic, but” Jo Nova” has a most interesting set of articles about the Silicon Valley Bank that you might like to share with your readers.
I’m too dull to be able to post it here, but it is your blog and you should control what takes up space.
Just read it.
Stealing a quote from the Climate Mafia:
“It’s worse than we thought…….”
Looks like you are going to be right on the bailout money too.
I am not happy about being “right ” !!!!!
The Jo Nova article seemed to attack the climate related loans made by the bank. But the bank did not collapse because many of those loans defaulted. They might have defaulted at some time in the future, but that had not happened yet.
The SVB bank collapsed because their large investments in Treasury bonds and mortgage backed bonds were not hedged with derivatives or interest rate futures. Those are safer investments than loans to startup companies.
But when interest rates rose, which was a predictable event with the high inflation rate in 2021, the value of their bond investments fell. Bonds would eventually get back to par at maturity, but a run on the bank forced SVB to sell bonds at a loss to get cash. No bank can survive a run because banks have short term deposits that are used for long term investments. Banks depend on customers trusting the bank and not suddenly wanting to withdraw their money.
Richard Greene
Bingham Farms, Michigan
Finance MBA
Author of the for-profit newsletter
ECONOMIC LOGIC for 43 years
Here’s the JoNova link:
https://joannenova.com.au/2023/03/silicon-valley-bank-was-a-big-green-government-ponzi-scheme/
“The New York Times tells us that the collapse of SVB is going to hit green tech hard because SVB clients included 1,550 companies dedicated to “fighting climate change”.
If only SVB had served coal miners or gas frackers instead they might still be in business? The deposits they needed would have kept on coming as the profits flowed in.”
But as I understand it, the facts are otherwise. SVB had more DEPOSITS in greater amounts from bigger companies than they could LEND. SVB over-“lent” to (or invested with, or bought bonds from) the US Treasury at a very low interest rate, just before the Federal Reserve system raised interest rates.
Another climate/numbers kind of guy looks at the situation and offers thoughts, here:
https://chiefio.wordpress.com/2023/03/13/some-notes-on-svb-other-bank-runs/
In order to keep the Ponzi Scheme going was “equity” — in the sense we all used that word before it got all tangled up in questions of accessibility and accommodations and diverse outcomes — “equity” in the sense of shared financial ownership. The resident who owns, with his bank, 20% of the value of the house he lives in has “equity”. And he has risk. If the value of his house goes down — well, the loan from the bank remains the same, so through no fault of the resident the “equity” he holds in his home goes down, too. It happens during the market cycle that “owners” can get “upside down” in their loans. The equity shared between lender and borrower isn’t enough to justify both parties their investment, and one or the other will walk away from the original contract.
The SVB is kinda sideways from that. Instead of having borrowed more at a higher interest rate than their “equity” stake in their own business could support, they lent more at a lower interest with far too few equity stakeholders with which to share (and spread) risks. They put all their money in one basket.
They should have sold shares in their own bank to some of their vulture-capitalist investors; who might have lost money during the recent “run on the bank” in the fashion demonstrated by George and Mary Bailey in the famous scene of the movie “It’s a Wonderful Life” where they, as owner-stakeholder-equity-investors put in (at risk of total loss) their personal (honeymoon) money to cover the unexpected demands. In the alternative, Old Man Potter could have put HIS money into George’s business with a “risk premium” discount “fifty cents on the dollar”.
Instead, the privately run bank took private investors’ money on deposit and lent it in long-term, historically low interest, to the US Treasury. The “investment” didn’t develop new technology or build homes or fix railroads or hire unemployable teenagers to build stone amenities in national parks … The Treasury basically pissed that money, (and lots more besides) away on various government social programs.
The only way Jo Nova’s summary might be correct is if the SVB bankers looked at, and rejected, investing in “Green” opportunities as TOO risky. All of them. Windmills and solar and geothermal and hydro and cold fusion and superconducting conduit and batteries… as is SVB looked at every horse in the race and decided NOT ONE could ever cross the finish line. And so SVB “invested” in Federal Bonds. (If the depositors were inclined, they could have invested in such bonds their own selves.)
Tying this back to the original topic and graphs and numbers stuff — it’s pretty obvious the mainstream journalists have no idea how numbers work. Especially when attached to money. Or voting. A “dump” of votes or funds or toxins or resources … just all “big number, stop thinking.” How many giraffes tall is an asteroid? Is the amount of dioxin in one accident bigger or smaller than the amount distributed across consumers’ statewide emission from intended use? Are the midnight votes counted in November this year consistent with similar voting in May or in previous years? We’re talking about people who don’t even recognize the questions…
You know. Science folks aren’t supposed to say smackdown.
It makes them sound more sciencie.
Meh.
I suggest AZ poll watchers get back on the job:
https://www.fox10phoenix.com/news/phoenix-voters-to-pick-2-city-council-members-in-runoff-election
Related:
https://tucson.com/news/state-and-regional/govt-and-politics/court-asked-to-toss-kari-lakes-latest-election-lawsuit/article_a509e304-c2b7-11ed-97a9-9f9b02620899.html
Congress has no authority to reject state electoral ballots.
This article is superficial mathematical meandering that does not identify even one illegal ballot. Over 154,188 illegal ballots would have to be identified and cancelled to change the Michigan vote from Biden to Trump in 2020. Meanwhile, I’m still waiting for your details of illegal ballot #1.
I HAVE NO REASON TO TRUST EDISON RESEARCH, WHICH IS MERELY AN EXIT POLLING ORGANIZATION.
The author also does not appear to understand that ballots delivered by mule, as in the photographs, do get counted. A vote does not change if delivered illegally. The mules could be prosecuted, but that does not change the vote.
It seems obvious the mules were harvesting ballots. Far too many ballots get mailed out due to voter rolls that rarely get updated to remove deceased people and people who have left the state. Too many ballots get mailed out. Democrats are good at returning them illegally. That is the primary election fraud.
The 2020 results for Oakland County were similar to 2020 pre-election polls. There was nothing suspicious about the vote totals. Democrats were even more popular in 2022 in Oakland County. If there was any real evidence of election fraud in Oakland County, I would be the first person to report it on my blog.
There was evidence of voter fraud in Detroit (Wayne County) with mules and after midnight votes that I did write about frequently in my blog in 2020 and 2021.
The population of Oakland County did not change much from 2016 to 2020, but more people there registered to vote in 2020. So what.
Richard Greene
Bingham Farms. Michigan
Oakland County
Trump voter in 2020
Your arm waives don’t really help the statistics Richard. You cannot really argue against probability and your denial of the data is just silliness. Edison research matches the state totals to the vote.
This means a large batch of votes was well outside of the norm and doesn’t represent a sampling of actual county voters.
I have no reason to assume that Edison Reason knew exactly when the ballots showed up for tabulating, exactly who the votes were for, or exactly where the votes originated from.
Who would give Edison such detailed information, and why would Edison be the authority?
I challenge the accuracy of the data.
Even if the data are correct, they can be explained without proving election fraud:
The most likely source of late votes would be from precincts within Detroit — a city where Biden got 95% of the vote, and Trump got 5%.
So any late batch of ballots from within Detroit would be expected to be 95% for Biden.
And if Detroit was the source of the late Wayne County ballots, then the heavily pro-Biden results are what would be expected.
The late ballots in Oakland County could be from the big city of Southfield, 70% Black, where 89% of the 2020 vote was for Biden.
Detroit and Southfield are exactly where a Michigander would expect late arriving ballots to have come from.
I have just explained a lot of legal late pro-Biden votes from Detroit and Southfield, that would be perfectly legal votes. And not election fraud.
Can you prove that I am wrong, or are you just speculating?
Richard Greene
Bingham Farms, Michigan
Oakland County
“Who would give Edison such detailed information, and why would Edison be the authority? ”
Edison Research is the organization which reports to the news sites on election night. The NYT has a link to this data on their site. They did not provide a link for 2022.
“I have just explained a lot of legal late pro-Biden votes from Detroit and Southfield, that would be perfectly legal votes. And not election fraud. ”
No bud. You didn’t. You simply wrote words that satisfied yourself.
I explained how late arriving ballots from two primarily Black Michigan cities would have given Biden a large boost in the Michigan vote.
You claim late arriving ballots must be fraudulent.
You have zero evidence of election fraud.
You can not prove even one specific ballot was fraudulent
You show many pictures of people who look like mules delivering harvested votes, but I calmly explained to you that mule delivered votes get counted just like non-mule delivered votes.
So your total evidence is some votes were tabulated after midnight and there are pictures of people who appear to be mules.
Your high level statistical evidence does not refute a single vote any more than the high-level statistical evidence I previously presented: The unprecedented bellwether county vote study and the unprecedented Census post-election poll results, do not change a single vote.
So is YOU who have nothing that will change a single vote
And I have nothing that will change a single vote.
Votes can only be deleted one by one
Any name on the voter roles is acceptable on a ballot even if that person has actually moved to another state and is no longer a legal voter in that state.
Any signature can be valid if the signature matching software is set so any name spelled right is accepted,
There are other devious tricks, that were used in Arizona in 2022.
Some of the best articles on the subject of election fraud are by Jay Valentine at American Thinker:
https://www.americanthinker.com/author/jay_valentine/
While we are busy arguing about fraud in Oakland County in 2020, our nation is drifting toward from socialism (my definition) to totalitarianism in not so slow motion:
— Persecution of MAGA Republicans for “crimes”
for which Democrats are exempt
=- January 6 Political Prisoners
— Censorship and Cancellation of opposing ideas
— Black Lives Matter Marxism
— Critical Racist Theory Marxism
— Attacking Christian moral values in schools,
while promoting homosexuality and transgenderism
(this as a Marxist strategy from one century ago)
— Brainwashing children in schools with leftism
— Demonizing CO2 to control the private sector
“You can not prove even one specific ballot was fraudulent”
It doesn’t make a lick of sense. Your assigned hurdle is that I must prove a ballot is fake AFTER all of the information identifying the voter is removed from it and I am not allowed to even see the ballots to make an attempt.
In fact, I’m not even allowed to see the envelopes.
Why are you making such a ridiculous argument?
Jeff, I said it was a bullshit statistic because it is literally without meaning. I think you should present the data and say why you find it questionable. In fact you have brought up many questions I should also like answered. But numbers have meaning, and incorrect ones should not be used. Assigning a probability based on the normal distribution is only valid if the data satisfy the criteria of the central limit theorem. Samples must be i.i.d., independent and identically distributed. These samples are not identically distributed, they are segregated by time and location. Therefore the probability obtained from a normal distribution has no attachment to reality, nor any interesting null hypothesis. It is meaningless and should not be used.
“Jeff, I said it was a bullshit statistic because it is literally without meaning. ”
Data is never without meaning even when you don’t have perfection. This is something a LOT of data analysts suck at understanding but this reply (right there <<<<) should address all of your point.
I’ve shown the data already in graphs
I’ve linked the data numerous times for your own use.
I’ve shown pictures of ballot dumps including the use of Cell phone images for payment.
I’ve shown video of how the ballot dumps occur
I’ve shown confessions of people being paid to dump ballots
I’ve shown video of trucks dropping off ballots in the middle of the night, well after collection hours
– as though it takes 7 hours to drive from Detroit to Detroit.
I’ve shown the locations where ballots were handed out for dropoff
I’ve shown bad signatures obviously not related to the registered voter.
I’ve shown the same person dropping off stacks of ballots multiple times.
I’ve presented a 400,000 vote increase in only the Atlanta area and ONLY for one party.
I’ve shown examples of other states which have clean bell curves. I’ve explained why they are different. How is it that some states have proper voting distributions?
Basically if you can’t figure this out at this point, it is your own intent to not figure it out.
I’m NOT casting a blanket “everything you say is bs” claim here. Just that the specific claims of “the probability of this vote ratio is 0.000000006” or whatever are wrong.
You are missing about 103 zero’s. That’s where perfection of data falls apart.
The values are far more extreme than can be explained by an actual sampling of voters.
You have no knowledge of how many zeros there should be. To calculate that you are using a Gaussian function, but such a function does not describe the data well at all.
You are free to show the data and explain why it seems unlikely to you. But numbers mean something, and that should be respected. If you want to use numbers that are calculated from totally incorrect assumptions you can, but I, an internet commenter, will disapprove.
“you have no knowledge of how many zeros there should be.”
Now that is a step too far. While i agree that the distribution can be non-normal to some extent. I’ve shown examples of that as well. –see ohio as one of them. We do have knowledge that there shouldn’t be 114 zero’s before the vote sample.
That is why this is such strong evidence and I did present it many months before the video of the stacks of ballots being dropped off by mules surfaced right in the exact same area, confirming my statistics did show a problem.
Here is a link to an article where I discuss the quality of knowledge of the distribution.
This is what I concluded.
This is a very basic thing I’ve done, and can be done using more sophisticated distributions but the result is so extreme that it is guaranteed to be the same, “not in this universe buddy”, kind of result…..
You have to be suspicious of after midnight ballot dumps in four states that had Trump leading before midnight, and then losing by the morning.
The number of late arriving ballots in Michigan, mainly in Detroit, were close to the number needed to change the lead from Trump to Biden. Very suspicious.
Te late arriving Michigan ballots could have been perfectly legal votes from the Black cities of Detroit and nearby Southfield where Biden got 95% and 89% of the total vote, respectively.
In Detroit, Republican ballot counting watchers were kept too far away from the counting — blamed on Covid — and thrown out of the building before the after midnight votes were counted. And windows were covered with cardboard so they could not look in. very suspicious.
All ballot counting watchers in Atlanta were sent home with the fake excuse of an overflowing toilet far away from where the ballots were. Then boxes of ballots were pulled out from under tables and counted without any watchers present. Very suspicious.
Unfortunately, very suspicious actions don’t change a single vote.
“Unfortunately, very suspicious actions don’t change a single vote.”
so your argument is that illegal ballots added to the system in stacks as shown in numerous video’s don’t change a single vote?